Data Instruments
Visualization tools for open data from the Human Resources Matching Survey by the Cabinet Office and the Population Census.
Visualization 01
Explore employment in Japan through the 2020 Census
Compare age, sex and location across occupations and industries.
Visualization 02
Basic view of the 2025 survey
Explore counts and shares by gender, age, work, education and location.
Visualization 03
Explore the survey through 11 attributes
Explore 11 linked distributions of gender, age, work, education and location.
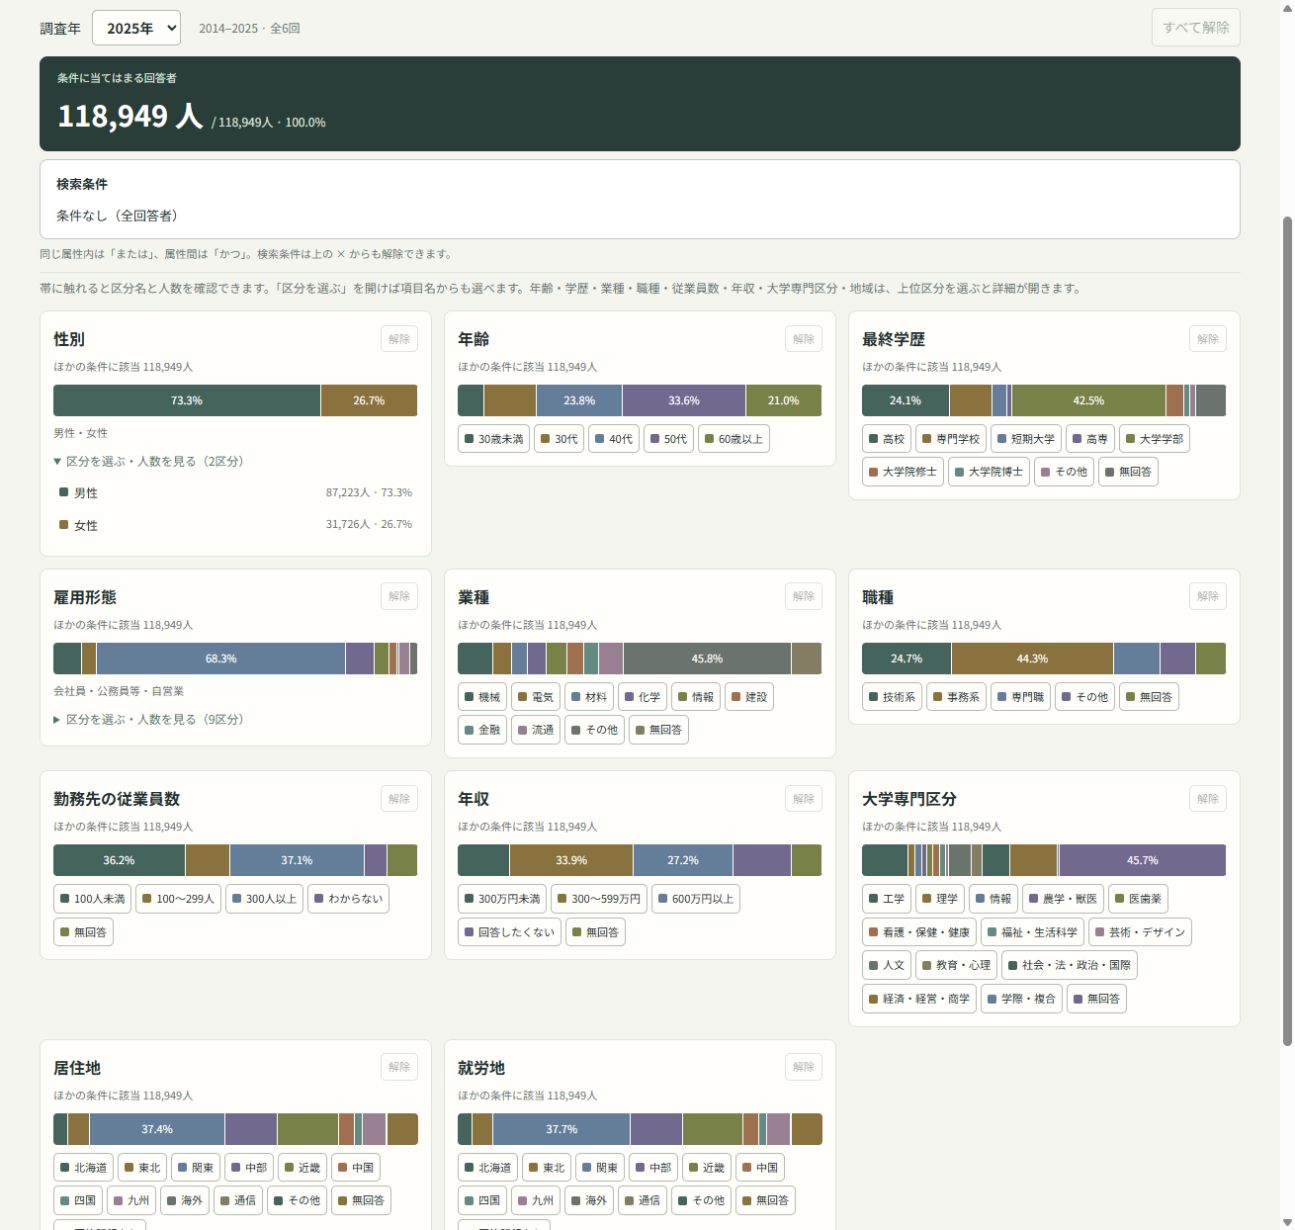
Visualization 04
Who does what kind of work?
Explore how age and gender relate to industry and occupation.
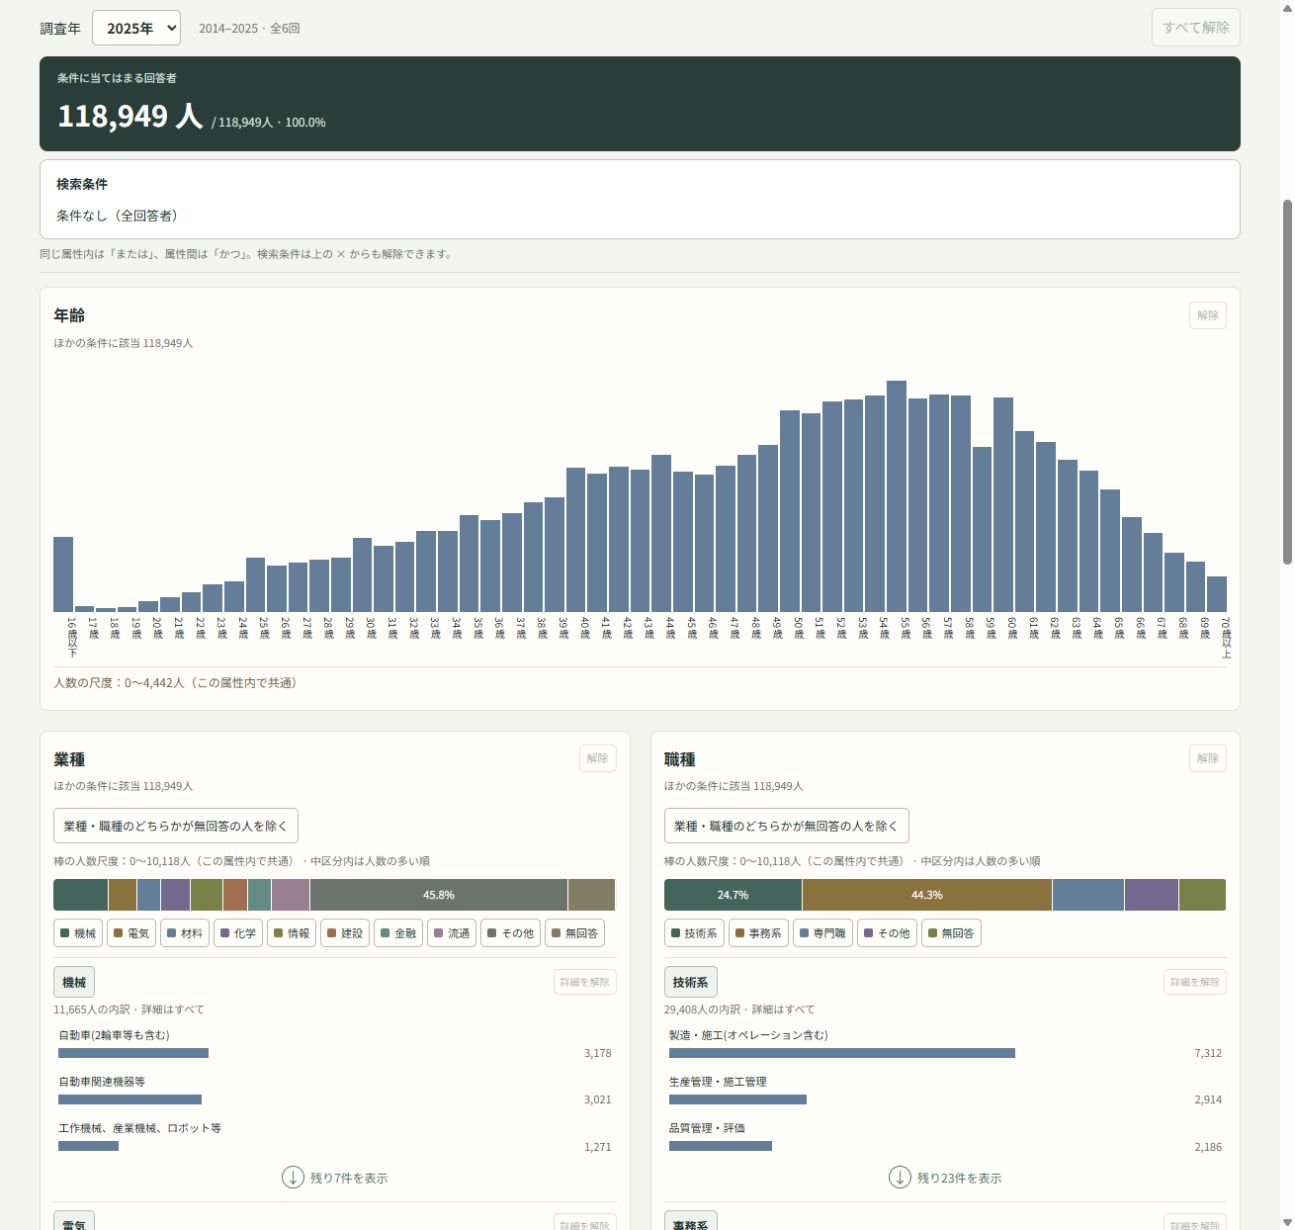
Visualization 05
How education connects with work
Explore people’s work by educational attainment and field of study.
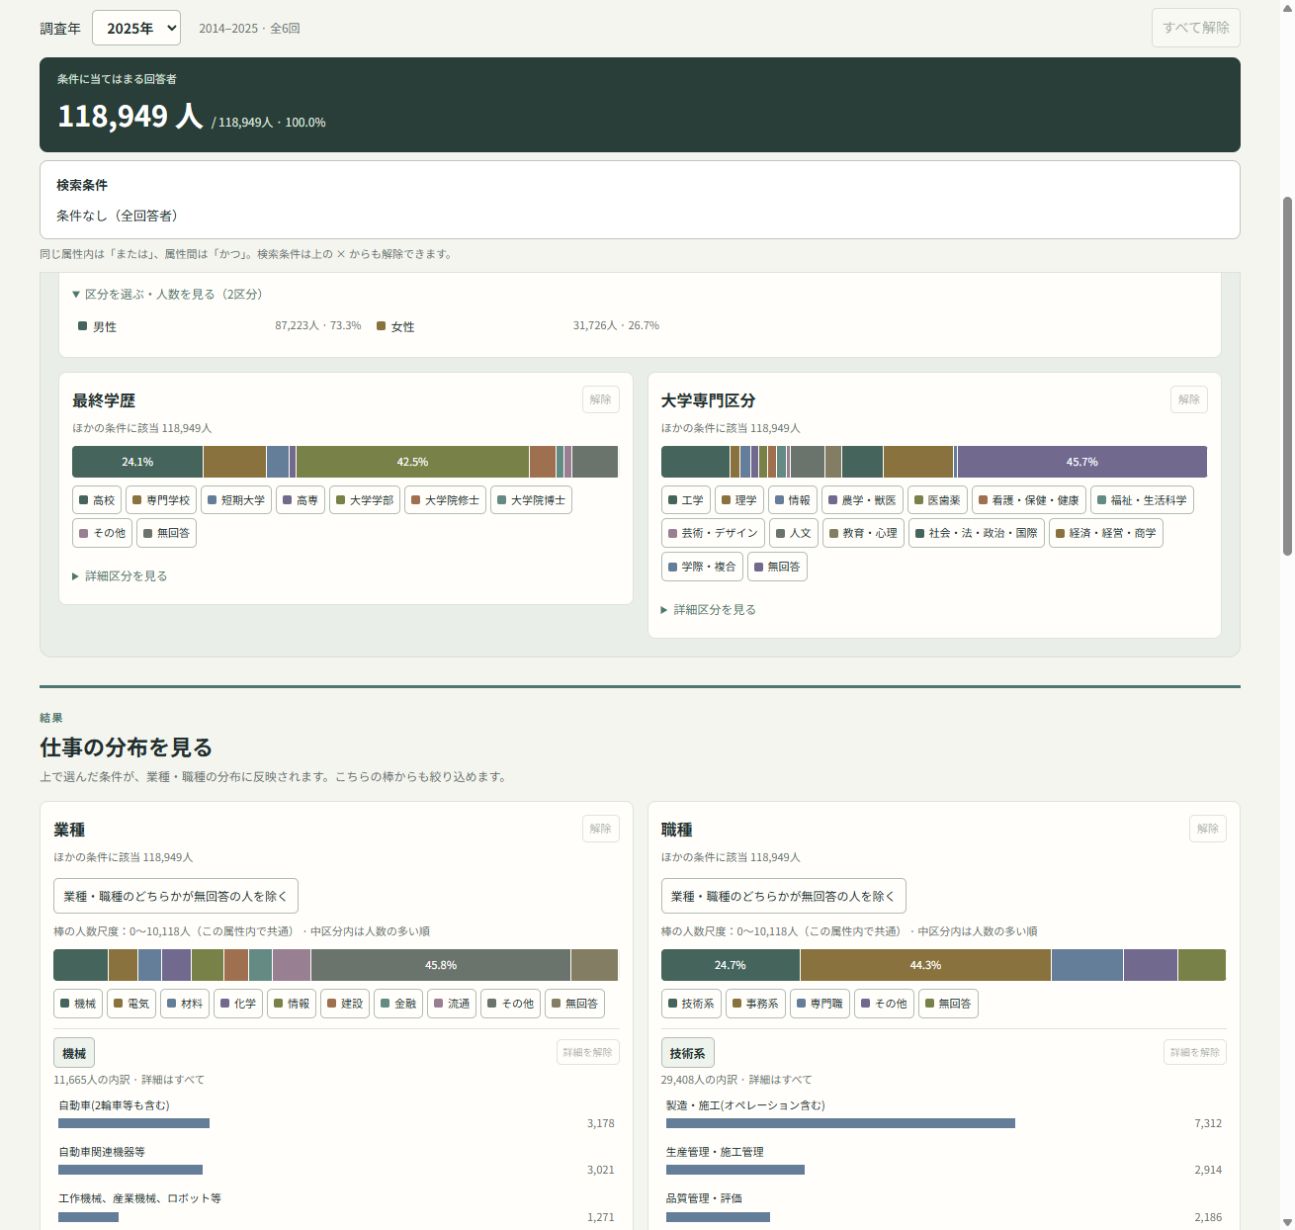
Visualization 06
Work and income distributions
Explore annual income by age, employment status and employer size.
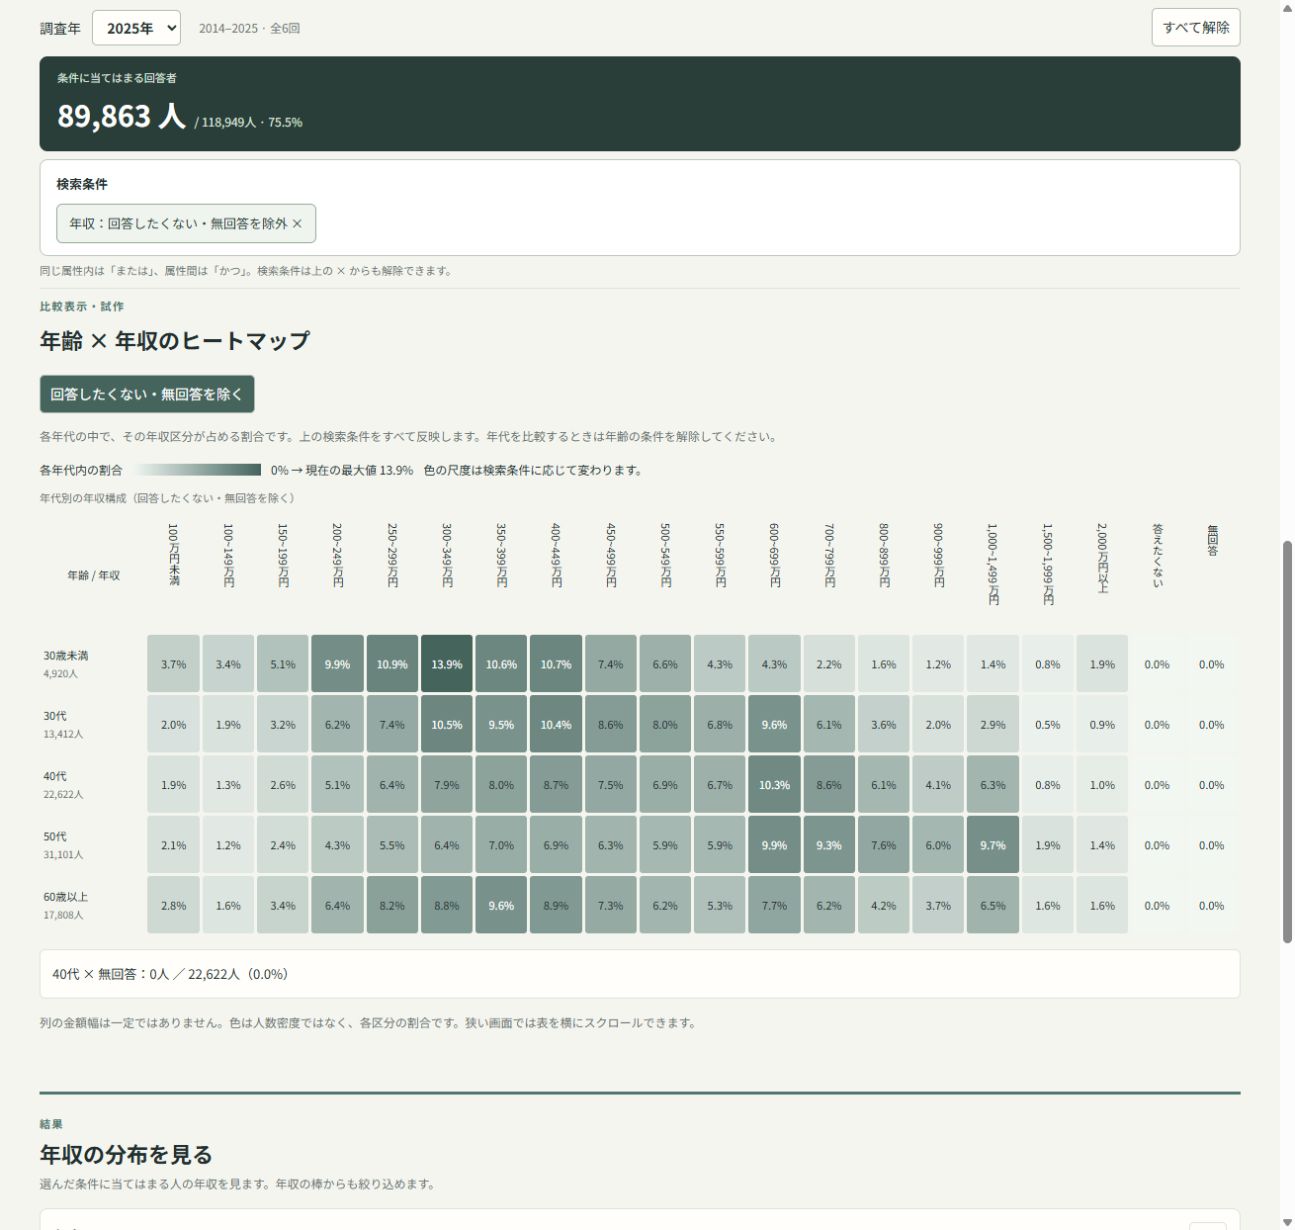
Visualization 07
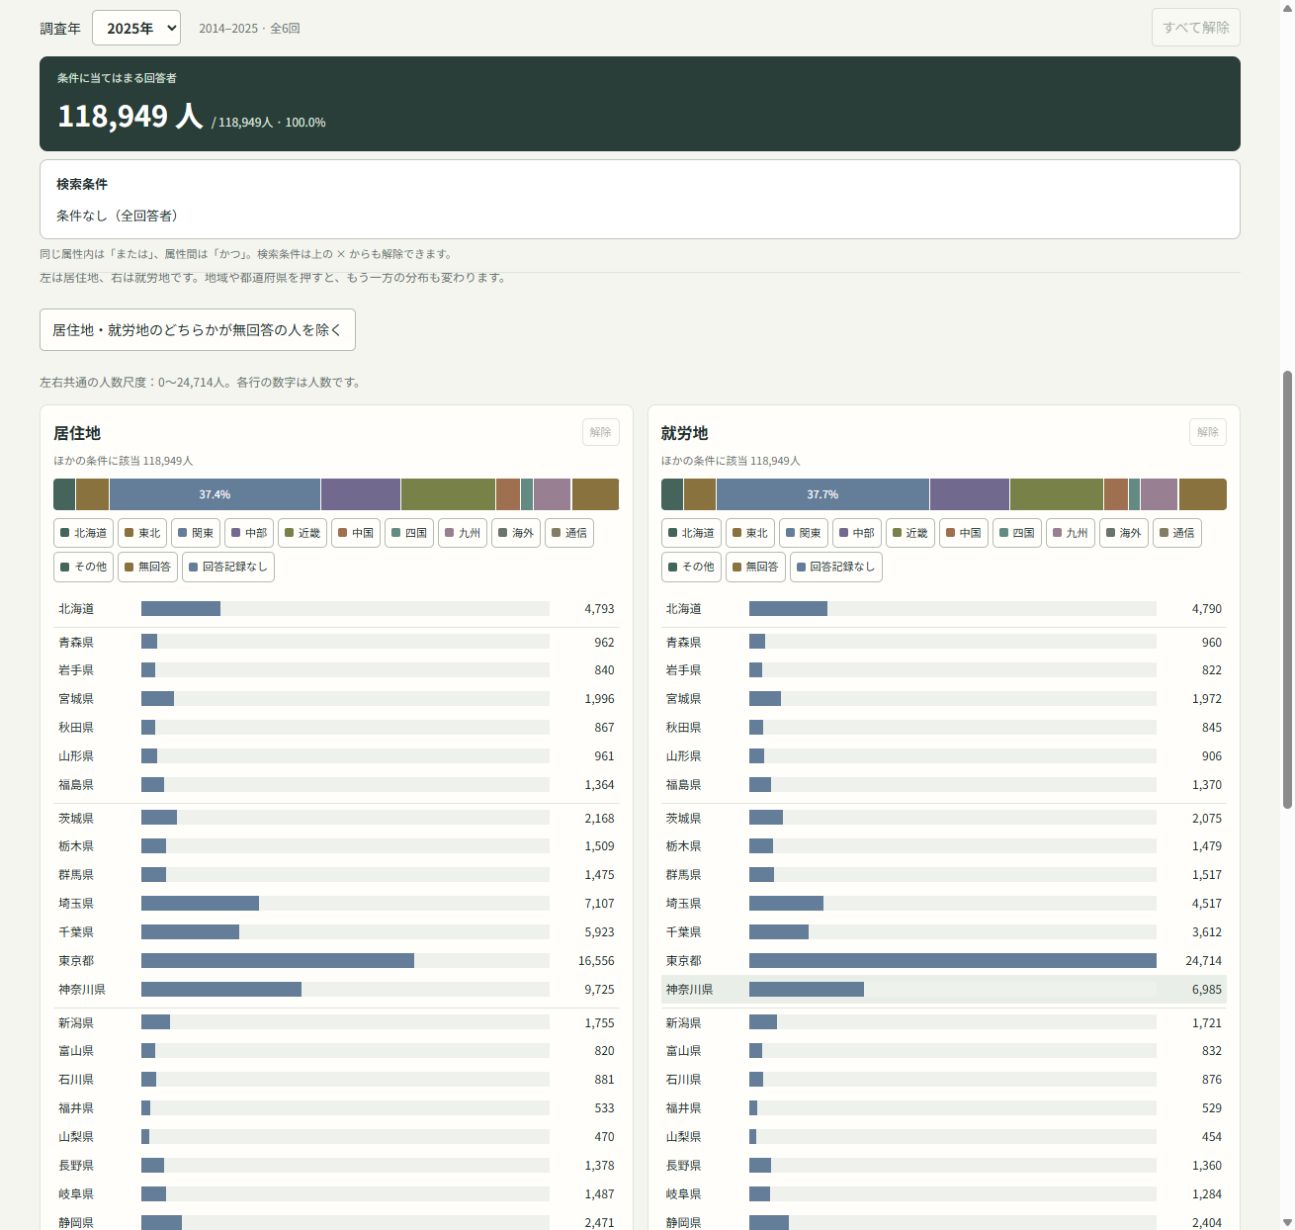
Where people live and work
Compare residence and workplace using the same bar-chart scale.
Related resources
Check the language and survey categories used in these visualizations.
- Japanese–English category reference ↗Search original labels, translations and explanatory notes.
- Specialty field reference ↗Read the 2025 options and extensions that preserve earlier responses.
- The four field groups and their placement rationale ↗Explore the links to school subjects and the grouping and placement of all 298 fields.
Related blog articles
- What is the Human Resources Matching Survey Open Data? ↗An introduction to the survey and five tools for exploring its data.
- Translating the survey’s categories ↗Our approach to preserving meaning and comparability across languages.